

Shear Cell testing was originally designed to determine the incipient flow of continuous, cohesive powders under applied stress in order to simulate flow from a hopper/silo. When testing powders of this type to understand hopper behaviour, Shear Cell testing is a robust and complementary technique to the other methodologies employed by the FT4.
However, as a result of the mathematical models applied, analysis techniques used to derive commonly reported parameters are subject to limitations that can make the resulting data unreliable. Mohr’s circle analysis can introduce significant variation in the evaluation of Shear Cell test results, even when the directly measured values show an acceptable level of repeatability.

Types of Parameters
Shear Cell testing returns two different types of parameter. Firstly, there are parameters directly measured by the test:
· Shear Stress (τ) as a function of Normal Stress (σ)
· Pre-shear stress at steady-state
These values are measured in all Shear Cell tests, and are not typically subject to any form of approximation. The Shear Stress is then plotted as a function of the applied Normal Stress, and the data points used to construct a Yield Locus. The position of this Yield Locus is a reliable, repeatable expression of the stress required for the powder to shear against itself.
Secondly, there are parameters derived using Mohr’s circle analysis. These include (but are not limited to):
· Cohesion, from the point that the best-fit line modelling the Yield Locus intercepts the y-axis.
· Unconfined Yield Strength (UYS), from the greater of the two points where small Mohr’s circle intercepts the x-axis.
· Major Principle Stress (MPS), from the greater of the two points where the large Mohr’s circle intercepts the x-axis.
· Flow Function (FF), from the ratio of MPS to UYS.
· Angle of Internal Friction (AIF), from the angle between the Yield Locus and the horizontal.
Examples of the Limitations of Using Derived Parameters
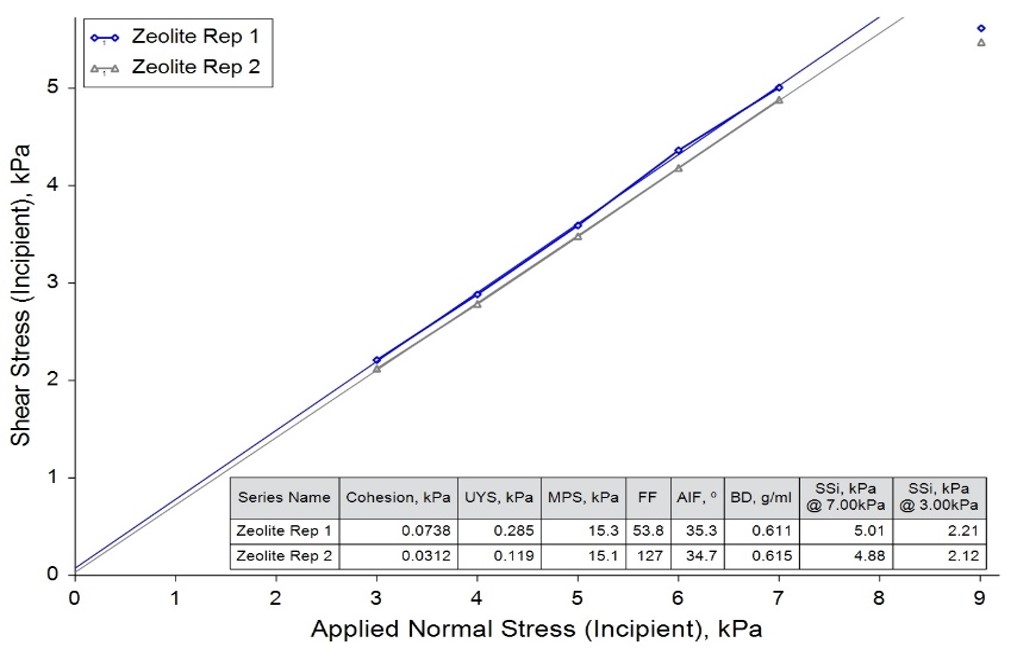
The derived parameters depend on a mathematical model of the measured data, and are reliant on the assumption that the relationship between Shear Stress and Normal Stress is linear. However, this assumption is not always a true representation of the powder’s flow properties. A powder that is very sensitive to applied stress can generate a steep Yield Locus, leading to a linear best fit line which intercepts the y-axis very close to zero, generating a very low value for Cohesion. The associated small Mohr’s circle will therefore be very small, generating a very low UYS and consequently a very high FF. This can be misleading, as it suggests that the powder is very free-flowing, when in fact it exhibits considerable shear strength at high consolidation loads. Furthermore, a very minor variation in the attitude of the best fit line for each repeat of the test will cause a relatively large change in the y-intercept, and therefore the size of the small Mohr’s circle, and the resulting Cohesion, UYS and FF values.
Figure 1 shows an example of this issue using repeat tests of a commercial zeolite powder. The variation in the measured Shear Stress values between the two repeats is very small (less than 3% RSD), but due to the y-intercepts of the best-fit lines being so close to the origin, the very small difference in the position of the line results in a variation greater than 100% in the UYS, and more than 150% in the FF. This is again a consequence of the model applied to the data rather than a true reflection of the nature of the powder.






















 (All Rights Reserved)