
Introduction:
The Chinese Pharmacopoeia 2025 has introduced significant revisions to the 9101 Guidelines for Validation of Analytical Methods further promoting the application of statistics in analytical method validation. How to use statistics for reporting validation data has become a challenge to be solved by analysts.
This article will interpret the data reporting requirements for the two key performance indicators "Accuracy and Precision" in analytical method validation. It will also provide a detailed explanation on how to use traditional Excel software for statistical analysis of validation data, aiming to assist industry colleagues in implementing the regulatory requirements promptly.
1. Separate Evaluation of Accuracy and Precision
The Chinese Pharmacopoeia 2025 requires that: All precision tests should report the standard deviation (SD), relative standard deviation (RSD) (coefficient of variation, CV), and an appropriate 100 (1-α)% confidence interval (CI) or other reasonable statistical interval. Accuracy test results should be reported as the average recovery of the analyte of known amount added to the sample, along with a reasonable 100 (1-α)% CI.
1.1 Standard Deviation (SD) and Relative Standard Deviation (RSD)
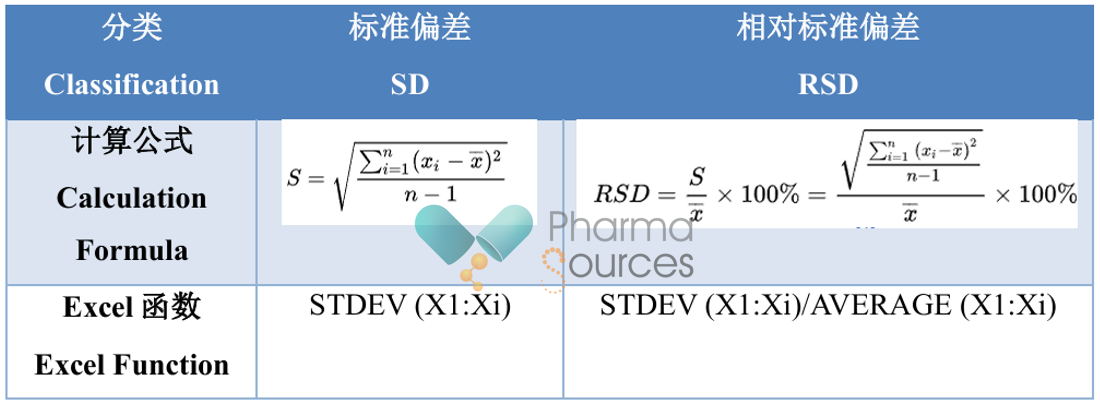
Both standard deviation (SD) and relative standard deviation (RSD) are used to describe the dispersion between test results. The calculation formulas are as follows:
1.2 How to Select the Value of α
The α represents the significance level, used to measure the probability of error in the results during a hypothesis test. The smaller the α, the smaller the probability of error. Typically, α is set at 0.05 because statistically, if the probability of an event occurring is only 5%, it is considered unlikely to happen.
Confidence Level = 100(1 - α)%. When α is 0.05, the confidence level is 95%, meaning: one can be 95% confident that the true parameter value lies within the calculated CI.
1.3 How to Calculate the Confidence Interval (CI)
A confidence interval consists of a lower confidence limit and an upper confidence limit, indicating the range within which the population parameter is likely to occur at a certain confidence level.
In analytical method validation, the sample size for repeatability is typically 1×6, and for accuracy, it is typically 3×3 or 1×6, all belonging to small sample data (n<20). Therefore, the t-distribution should be used to calculate the CI. The formula is as follows:
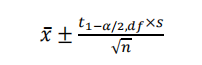
Wherein: df denotes degree of freedom n-1;
t1-α/2, df is the 1-α/2 quantile of the t-distribution with df as the degree of freedom and 1-α as the confidence level. When calculated using Excel, the function is TINV(α, df).
When √n is calculated using Excel, the function is SQRT(n).
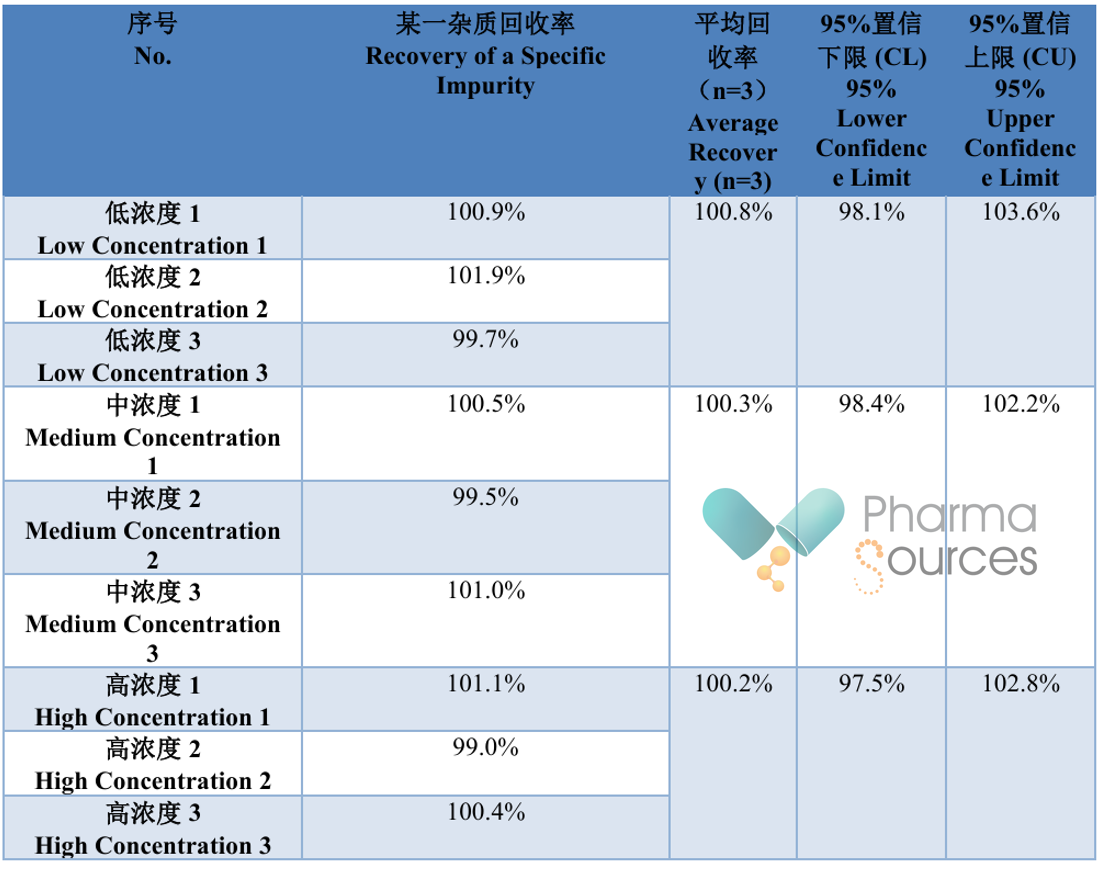
1.4 Data Reporting Example
Table 1.4.1 Repeatability Results (Example)
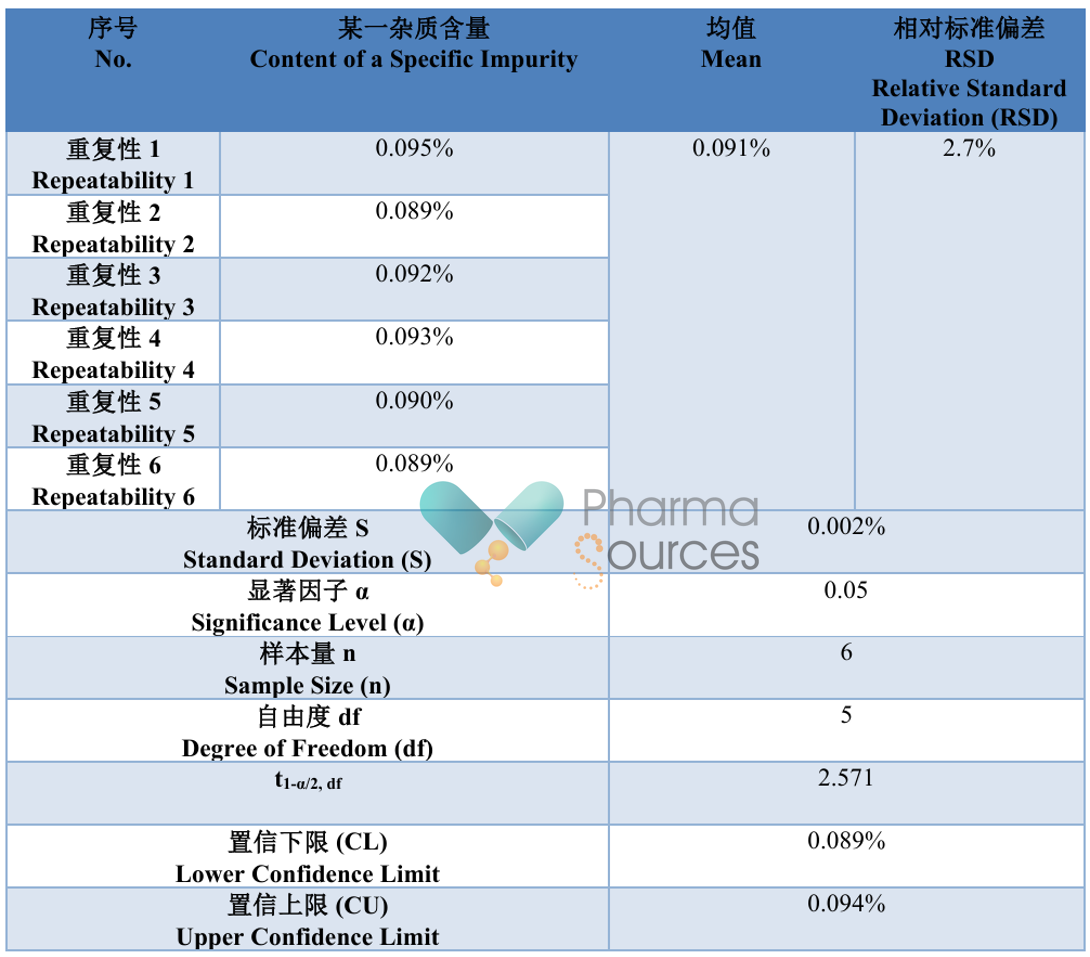
Table 1.4.2 Accuracy Results (Example)
























 (All Rights Reserved)